The most in-demand languages for US businesses in 2026
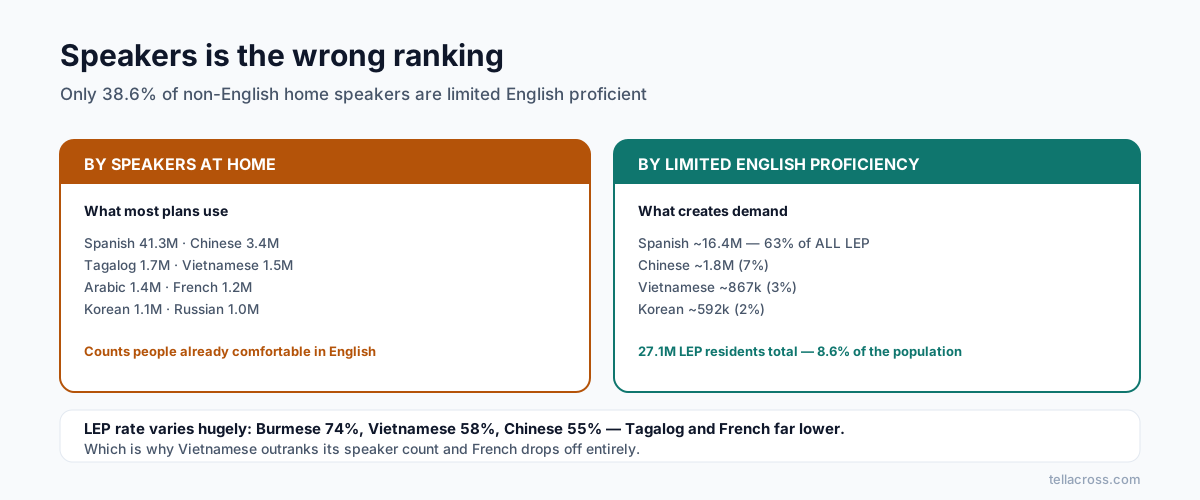
Speaker counts are the wrong ranking. What determines business demand is how many of those speakers have limited English proficiency — and by that measure the order changes substantially.
Prakash Vakhesa · October 13, 2026 · 5 min read
Disclosure: we make TellAcross, a call translation tool, so we have an interest in this question. The data below is from the Census Bureau and Migration Policy Institute and is linked throughout — check it rather than taking our word for it.
Most "top languages in the US" lists rank by how many people speak a language at home. For a business deciding which languages to support, that's the wrong number.
A language only creates demand for language services when its speakers can't comfortably conduct business in English. And the gap between those two things is much larger than people assume.
The number that matters
The American Community Survey (2020–2024 five-year estimates) counts 27,139,643 US residents aged 5 and over who speak English less than "very well" — 8.6% of that population.
More usefully: that's 38.6% of everyone who speaks a language other than English at home. So roughly six in ten people speaking another language at home are still comfortable in English. Ranking by speakers counts all ten; ranking by limited English proficiency counts the four.
Ranked by speakers at home
For reference, the languages spoken at home by more than a million people (2020 figures):
| Language | Speakers at home |
|---|---|
| Spanish | 41,254,941 |
| Chinese | 3,404,634 |
| Tagalog | 1,715,436 |
| Vietnamese | 1,523,114 |
| Arabic | 1,390,937 |
| French | 1,175,318 |
| Korean | 1,073,462 |
| Russian | 1,044,892 |
This is the list most businesses plan from. Now apply the filter.
Ranked by limited English proficiency
LEP rates vary enormously between language groups. Burmese speakers show the highest share at 74%, with Vietnamese and Nepali at 58% and Chinese at 55%.
Applied to actual LEP population counts:
| Language | LEP speakers | Share of all LEP |
|---|---|---|
| Spanish | ~16.4–17.2 million | ~63–64% |
| Chinese | ~1.8 million | ~7% |
| Vietnamese | ~867,000 | ~3% |
| Korean | ~592,000 | ~2% |
Sources: Migration Policy Institute and MPI state profiles.
The reordering is the interesting part:
Spanish is not merely first, it's most of the problem. At roughly 63–64% of the entire LEP population, Spanish isn't one language among several — for most US businesses it is the language access question, and everything else is a long tail. If you support one language, this isn't a close call.
Chinese and Vietnamese punch above their speaker counts. Vietnamese has fewer than half the home speakers of Chinese, but a 58% LEP rate means its business demand is much closer than the raw ranking implies.
Tagalog drops sharply. 1.7 million speakers at home, but English is widely spoken in the Philippines, so a far smaller share of those speakers need language support at all.
French drops further still. Over a million speakers, and the LEP share is low — many are bilingual by education rather than by recency of migration.
MPI notes the drivers plainly: the foreign-born share of a group, colonial-era English exposure, educational attainment, and whether people arrived for skilled work or as refugees. Refugee-origin communities show consistently higher LEP rates than skilled-migration communities — which is why Burmese tops the list at 74%.
The ranking that actually applies to you
National figures are a starting point and a poor plan. Language distribution is intensely regional: a clinic in Minneapolis and a clinic in Miami have almost nothing in common in this respect.
Do this instead, in about an hour:
- Pull your own data. Customer records, call logs, intake forms. Most organisations hold this and have never aggregated it.
- Check your specific geography. MPI publishes state-level language profiles; county-level ACS data goes further.
- Weight by the value of the interaction, not just frequency. Ten routine calls may matter less than one high-value conversation that failed.
- Look for the absence. The clearest signal isn't which languages appear in your records — it's which local-population languages don't, because those are people who aren't reaching you at all.
That last point is the one that finds real money. If your county has a substantial Vietnamese-speaking population and your customer base has almost none, you're not looking at a demographic quirk.
What this means practically
Almost everyone should support Spanish. The concentration makes this the single highest-return decision available.
Second-language choices should be local, not national. Chinese nationally, Somali in Minneapolis, Haitian Creole in South Florida, Hmong in parts of Wisconsin, Portuguese in parts of Massachusetts. The national list will actively mislead you here.
Coverage breadth matters for unpredictable contact. A hospital, a utility or a public-facing service can't choose who calls. If you can't predict the language, breadth is worth more than depth — which is a different purchase from supporting two languages well.
Be honest about which interactions need a human. Support in a language is not the same as meeting a legal obligation to provide qualified interpretation, and for clinical, legal and regulated conversations, the second is what applies.
The honest summary
Rank by limited English proficiency, not by speakers, and the picture sharpens: Spanish is roughly two-thirds of the entire question, Chinese and Vietnamese are the meaningful second tier, and several languages that look large on a speaker ranking generate far less demand than their size suggests.
Then throw the national list away and build the local one from your own records — including, especially, the languages that are missing from them.